When you stop to think about it, the world is a big place. Most fantasy “world" maps are nowhere near the proper size. Consider, for example, Middle-Earth, the setting of Lord of the Rings:
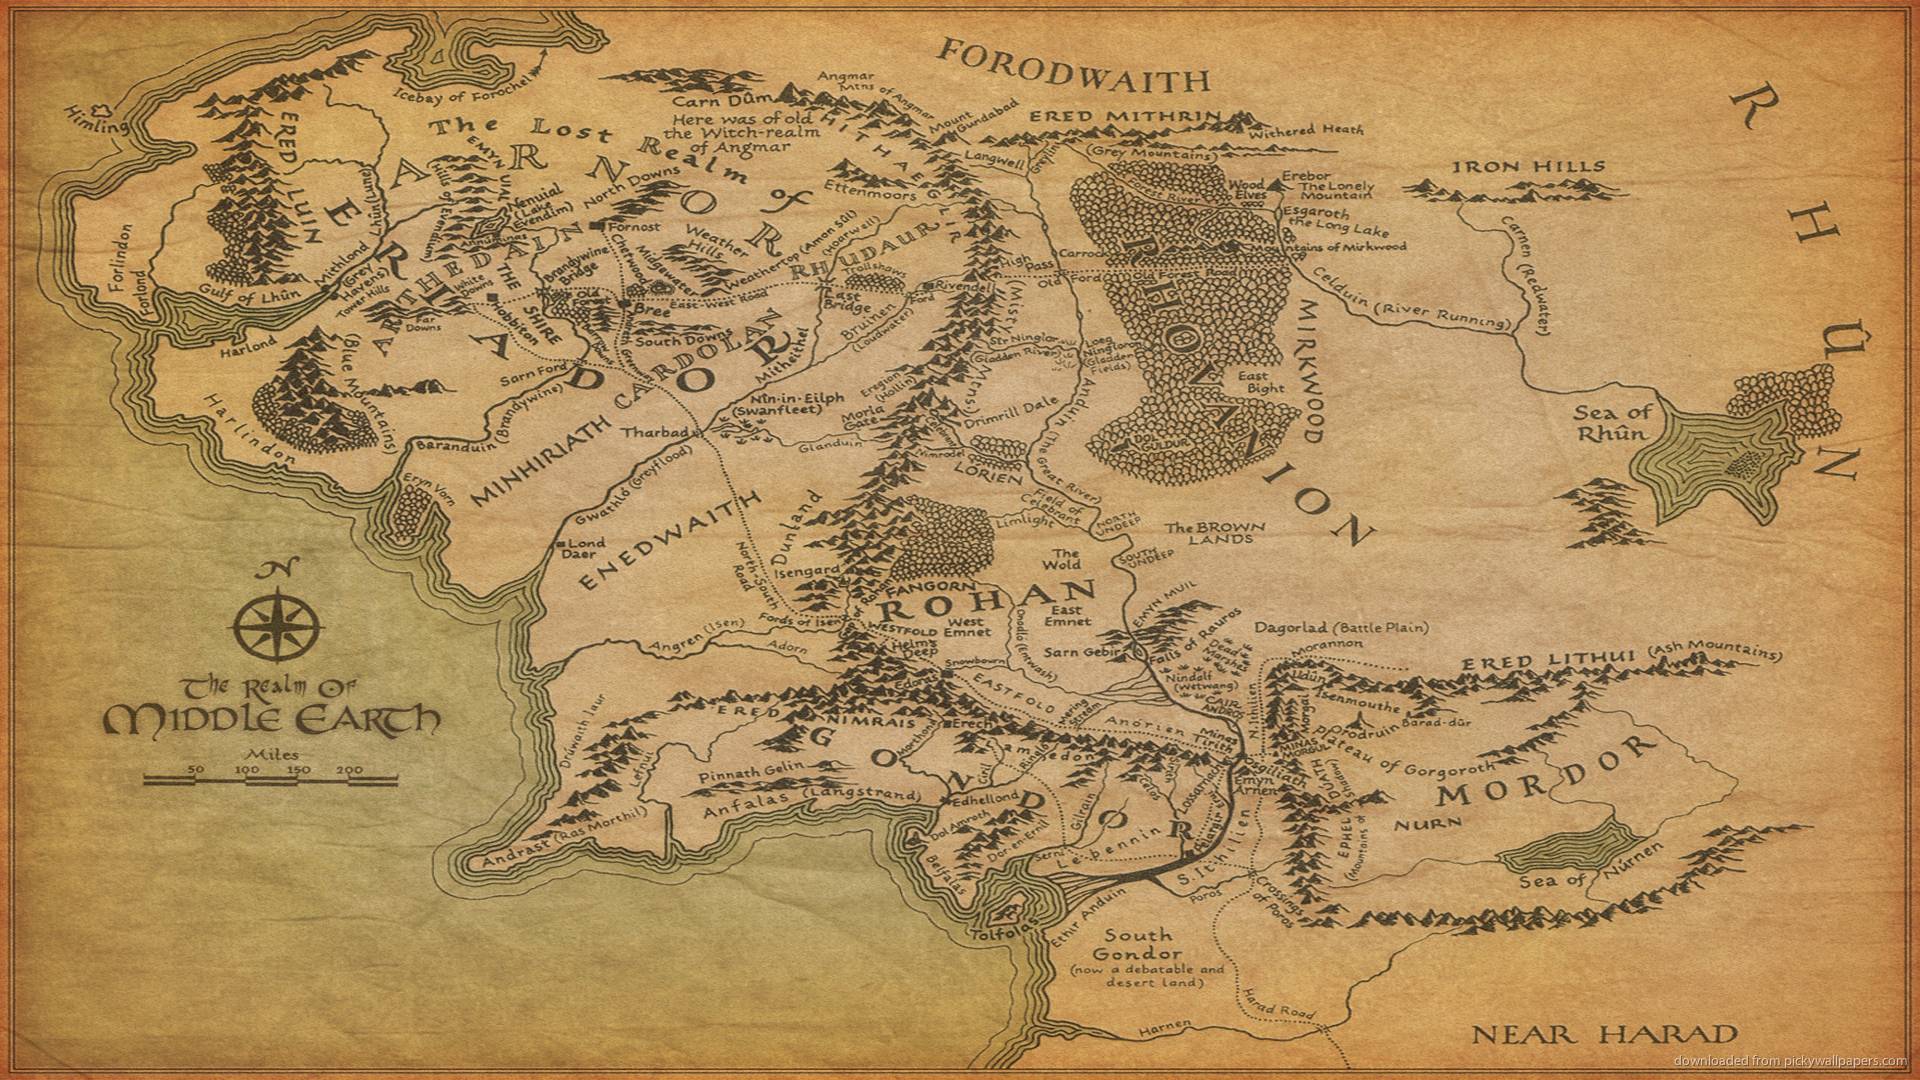
While seemingly depicting a huge world, in fact Middle Earth is based upon Europe:


So generating a real “world map" is probably too ambitious. A better target would be a continent (or partial continent) sized map. (Although it's convenient to still think of this as “world" sized.) So how big a map would that be? If the current Dragons Abound maps are “sub-continent" size, this suggests that I might want to be generating maps that are 8-10x as large.
Before I jump into the challenge of generating bigger maps, I need to have a better understanding of the different coordinate systems Dragons Abound uses. I inherited multiple coordinate systems from Martin O'Leary's original code, and their interactions can be confusing, even after working with them for two years. Mostly I've gotten away with not fiddling with them, but obviously I'm going to have to do that to generate bigger maps.
To start with, the “world" behind the regional map is currently generated within a unit square. Each regional map has locations from (-0.5, -0.5) to (0.5, 0.5) with the origin (0,0) in the middle of the region.

This coordinate system is independent of how the map will be displayed. It's just a unitless system for constructing the world -- a city is located at (0.12875, -0.223), a border runs from (0.337, 0.010) to (0.333, 0.017), etc. And while the current regional maps are limited to 0.5 to -0.5, that's not a limit on this coordinate system. I can create world outside of these limits.
The next coordinate system is what SVG calls the viewbox. This establishes the actual coordinates that will be used to draw the graphics. For example, Dragons Abound sets the viewbox to start at (-500, -500) and have a width of 1000 and a height of 1000:

You'll note that with this choice, converting between the first coordinate system and the second system just involves multiplying everything by 1000. So to draw something, Dragons Abound finds its location coordinates, multiplies by 1000, and draws to those SVG coordinates.
So I can use the viewbox coordinates to draw a line from (say) (0, 0) to (250, 250). But I don't really want that to draw a line from (0, 0) to (250, 250) on the computer screen. For one thing, that would mean that if I wanted to display the map at a different point on the screen, I'd have to change all the coordinates of everything on the map and redraw it. That would be painful.
To handle where the graphics show up on the screen, there's a third coordinate system which SVG calls the viewport. The viewport is the actual part of the page where the graphics will be drawn (on a web page, it's an <svg> element). It has a width and a height and a location. The location is the coordinates of the upper-left corner of the viewport. So if I was displaying a map in a viewport at (30, 100) that had a height and width of 800, the viewport coordinate system would look like this:

So to recap: A city located in the world at (0.10, 0.33) is drawn at (100, 330) and shows up on the screen at (110, 764).
You can see why keeping track of this can be confusing!
What happens if I change each of these coordinate systems? In the first coordinate system, suppose I generate a world that only goes from -0.25 to 0.25 in each axis. Then the resulting world is only a quarter the size of my usual world and only fills up the middle part of the entire viewport:

What happens if I double the size of the viewbox? Well, if I also double the ratio between first coordinate system and the viewbox (from 1000 to 2000), then nothing much happens. If I keep the ratio at 1000, then once again the map is reduced to half size.

Conversely, if I halve the viewbox size, it has the effect of zooming in on the map:

A more useful aspect of viewbox is to change the origin. So far, I have kept the viewbox centered on the map, but that's not required. For example, I can shift the map to the right by centering the viewbox on a point on the left side of the map:


To summarize, then. There are three coordinate systems in use. The first is an abstract coordinate system for the world features. The second is the viewbox, and it defines the portion of the world that is visible. The third is the viewport, and that controls where on the screen the map is drawn. To draw a bigger world, I need to expand the first coordinate system. To show more on the screen, I need to expand the viewbox. I can also slide the viewbox around to show different parts of a larger world.
Next time I'll work on fixing some of the inconsistencies that arise when I use the viewport to show only part of a larger map.
"Only" three coordinate systems? I swear some of my projects at work have up to five coordinate systems, and the transforms include rotation and mirror as well. It's madness! Anyway, at least it sounds like you have a good understanding of what your coordinate systems are. It would be neat to have a full world map that you can pan and zoom in like Google Maps.
ReplyDeleteI stumbled on your blog (how has it been hidden so long?) and was struck by the quality of your rivers. Also your maps are gorgeous.
ReplyDeleteI wrote an app (https://www.drivethrurpg.com/product/217951/Sandbox-World-Generator) to procedurally generate content for D&D 3.5 - it's not enough to say there's a kingdom there, I want to know the king's class and level, who is in his court, and how many soldiers he has and what they are armed with! But to do this I had to have a map first, so I wrote a map generator which sort of works (doesn't make realistic islands though, and my rivers are laughable).
The app lets you zoom in and see more detail; I have dreams of an app that starts at the continental level and lets you zoom down to tactical maps of 5' squares, where every NPC has a complete statistic block and randomly generated background that reflects the NPCs around him. And in those dreams my map looks as beautiful as yours. But unfortunately I have a day job.
If only we could get people to pay us to do the fun stuff!
Thanks for the kind comments! I've had people offer money for this, but not enough to live on :-). So I'm happy to keep working on it as a personal growth project.
ReplyDeleteHey! I can't see that 2nd image, as I'm using Firefox and it's webp :-/
ReplyDelete