Sunday, November 25, 2018

Continent Maps (Part 5): Weather

I ended Part 3 of this series with some examples of continent maps, such as this one:

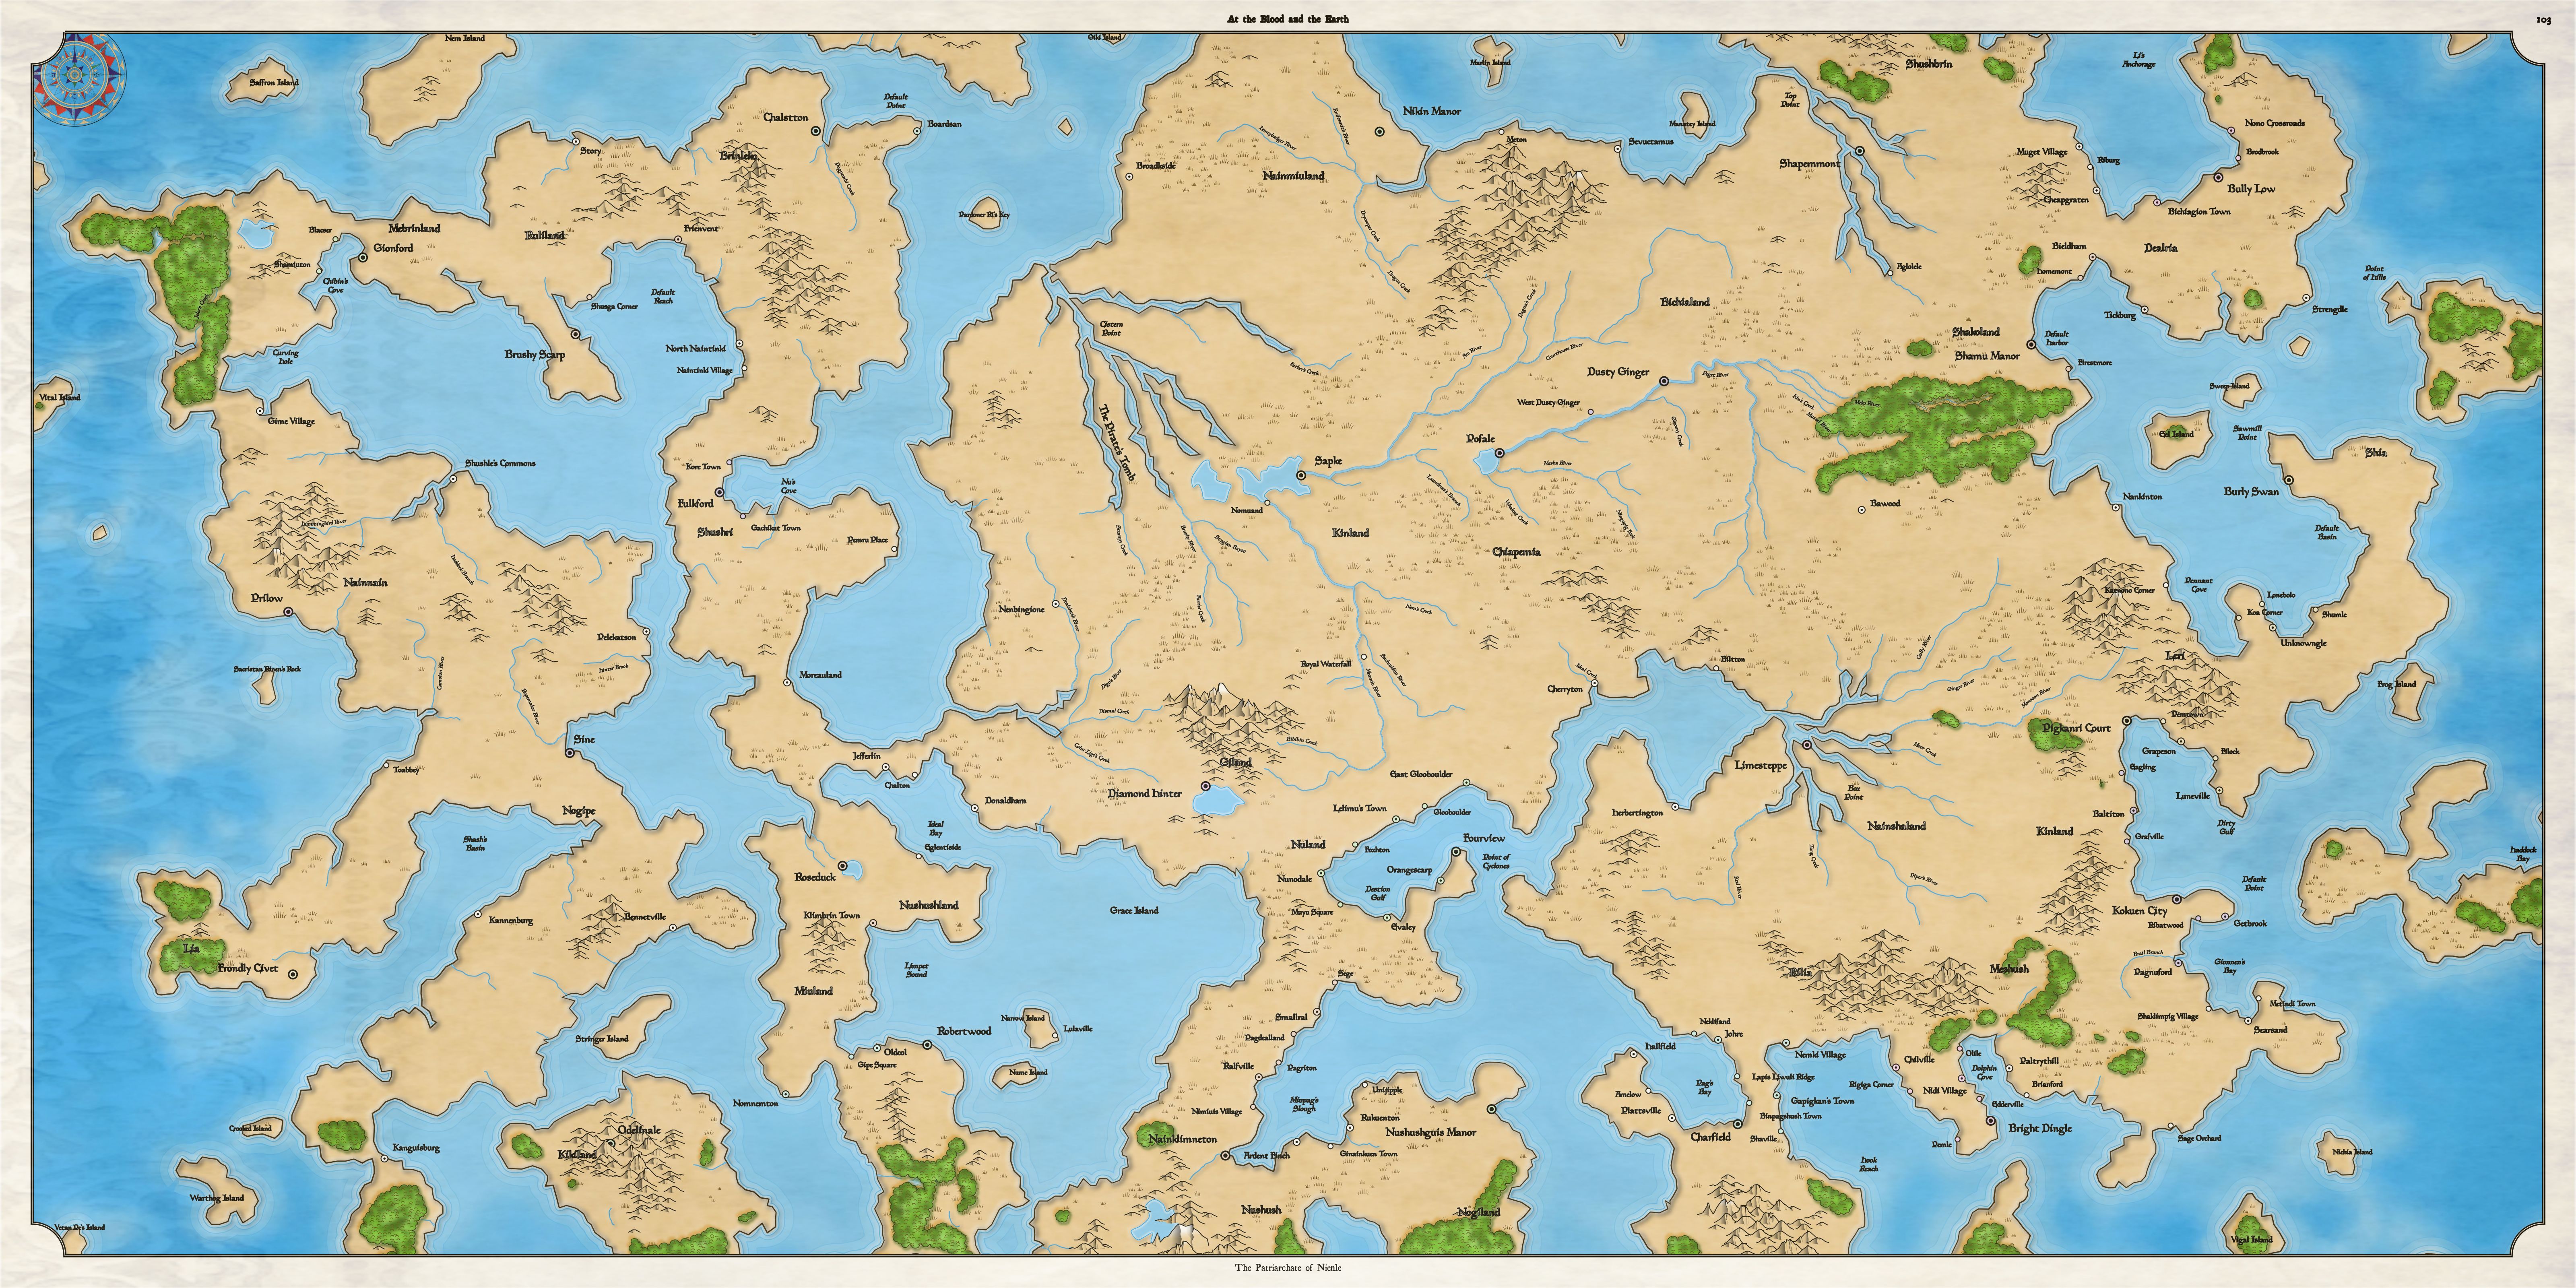
One thing you might notice about this map is that all the forests run generally southwest-northeast.  That's because the prevailing winds on this map blow in that direction.  Of course mountains can break up these flows, but if there's no terrain features it tends to create these sorts of long straight forests.  This works okay on a regional map, but as the maps get bigger it starts to look very strange.  So I want to implement some additional complexity in the wind model to address this.

Global wind patterns are complex, but one major component are the circulation cells that drive the trade winds.  I have no intention of trying to make a realistic model of these circulation cells, but I think I can implement a simple model that captures some of the dynamics.

(Note:  For simplicity's sake, I'm going to focus on an Earth-like model and primarily the northern hemisphere.  There's certainly some interesting ideas in things like a planet that turns the opposite direction, or is much bigger than the Earth, etc., but those topics will have to wait on some mythical future day to be explored.)

(Warning:  If you're any kind of an atmospheric scientist, please read no further.  You're likely to be offended or made seriously ill by the misconceptions and bad science that will follow.  Spare yourself and exit now.)

This image gives a notion of what I'm trying to implement:
The northern hemisphere has two circulation cells.  Between 60 N and 30 N, the winds flow northward and turn eastward to create the westerlies.  Between 30 N and the equator, the winds flow south and turn westward to create the northeast trade winds.

Dragons Abound simulates wind with a flow model. The wind in a location is represented a vector of the wind force and direction. At every time step of the model, the wind in every location is propagated forward based upon its direction. If the new location for the wind is higher, then some of the wind is turned aside while some of the wind continues upward but at less force. How the wind splits depends upon the steepness and direction of the slope. Conversely, wind going downward increases in force and turns towards the downward slope. All the wind entering a location is then summed to get the new wind force and direction for that location. This repeats until all the wind has propagated across the map and disappears out the edges.  To model the circulation cells, I will need to tie the natural wind direction in a location to its latitude.

At the moment Dragons Abound doesn't know anything about the latitudes of a map, so I'm going to begin by assigning latitudes to the maps.  How many degrees of latitude should a regional map like the one above cover?  A degree of latitude is roughly 69 miles.  I've never specified a scale for my regional maps, but it seems doubtful that they're more than 500 miles top to bottom, which would mean each map covers maybe 5-6 degrees of latitude.

The wind in a location will depend upon its latitude.  From 30 degrees North to the equator is the Hadley cell.  In this area, the prevailing winds blow south and turn to the west.  From 30 degrees North to 60 degrees North is the Ferrel cell, where the prevailing winds blow north turning east.  (Where they meet at 30 degrees North the surface wind is coming down from the upper atmosphere and then flowing off to the north or south.)  The southern hemisphere is the just the reverse.

On a regional map this variation of wind direction doesn't have much effect.  It's more noticeable on a continent map, particularly one that crosses over the 30 degree North latitude.  Here's a composite of the top and bottom of a long continent that crosses the equator:
You can see that in northern (top) part of the map, the trade winds blow to the southwest, while in the southern (bottom) part of the map, the trade winds blow to the northwest.

Here's a map that's 4x the size of a regional map to show these wind patterns on a continent-sized map:
You can see how the wind shifts from the bottom of the map to the top, but the result is still the unrealistic-looking stripes of forest across the map.

Fundamentally, the wind model I'm using is just too simplistic to generate convincing continent-sized wind patterns.  It works pretty well at capturing the impact of terrain on wind, and may even be good at capturing year-long dominant wind patterns.  But biomes are shaped by not only the prevailing winds, but winds from storms, coast effects, and so on.

Of course modeling all of that would be difficult, hard to get right, and probably very slow.  So I looked for a simpler alternative that might give acceptable results.  One possibility that occurred to me was to run a second precipitation cycle on the map, using another wind direction.  The resulting biomes would then come from a mix of the two precipitation cycles, adding complexity and (hopefully) eliminating the obvious wind alleys of the maps above.

You might think that a drawback of this approach is that doubling the precipitation would create lots of swamps and other wet biomes.  Of course I could halve the precipitation in each cycle, but in fact I don't need to do that.  I decide in a separate step whether a map is going to be “wet," “normal," or “dry" and then I scale the output of the precipitation model accordingly.  This has a couple of advantages.  First, I can select what sort of map I want without having to worry about what sort of map the precipitation model might produce on it's own.  Second, it means I don't have to try to tune the precipitation model to produce a reasonable amount of precipitation across the many different sorts of maps I produce.  And in this case, it means I can run the precipitation model multiple times and the normalization will adjust the precipitation to fit the kind of world I've chosen.

For the second run of the precipitation model I adjust the wind to come from 90+ degrees away from the original wind, and I also adjust the wind force to be randomly a fraction of the original wind force.  Here's an example of the result:
Not a particularly interesting map, but you can see how the second wind precipitation has added complexity to the biomes.  Varying the strength and direction of the second wind can make the biomes more or less different.  Turning down the strength can produce something like this:
where the original wind pattern is still largely evident.

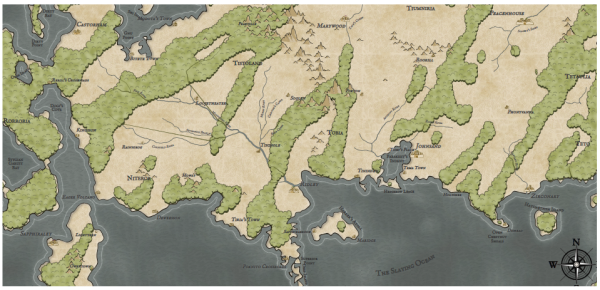
Here's an example on a more interestingly-shaped map:
Remember that I'm not particularly trying to create a procedural world model (like Dwarf Fortress, say) or even to create “realistic" biomes.  I'm trying to create interesting and plausible maps.  For that purpose, this approach works pretty well.  The forests are sensible and indicate some underlying climate (the eastern part of the above continent clearly gets more rain than the western part), and they're also spread out and have varying sizes, which is good for the storytelling aspects of the map.  So this will do for now.

Thursday, November 15, 2018

Continent Maps (Part 4): Wind Model

As mentioned last time, at continent size the Dragons Abound maps start showing some odd (unrealistic) weather and biome patterns.  In this example, you can see that the forest line up in stripes along the prevailing wind direction:
This isn't broken code, it's more that that weather and biomes model is too simple and the seams start to be obvious at this scale.  To address these problems, I'll start by revising the wind model.

I'd like my wind model to better reflect the kinds of wind dynamics you see on Earth:  circulation cells, trade winds, and the like.  These dynamics might help address the odd weather patterns on continent-sized maps.  However, working to add these re-opened my festering discontent with the Dragons Abound wind model, which is slow and seems overly complicated.  (You can read about my original implementation of the wind model starting here.)  Thinking about it for a few days, I decided that most of the problems ultimately trace to the fact that the Dragons Abound map is represented as a Voronoi diagram.  (Or more accurately the Delauney triangulation of the Voronoi diagram.)  This has many advantages for terrain generation -- combined with noise it can produce pleasingly natural looking land masses -- which is why you see it used so often for terrain generation.  But because the individual triangles are various sizes and orientations, any calculations like the wind model that rely on affecting neighbor cells can become quite complicated.  It would be much easier to model wind across a grid of equally spaced, identical regions.  Also, the wind model probably doesn't need to be at as fine a scale as the land. 

But I don't want to abandon the Voronoi diagram that underlies Dragons Abound completely.  (For one thing, that would require rewriting almost the entire program!)  Instead, I want to experiment with mapping (heh) the map onto a regular grid, running the wind model there, and then mapping back.  If the expense of copying back and forth to the regular grid isn't too bad, this might make the wind model faster and simpler.

What sort of grid should I use?  Ideally, the grid would consist of identical regions, all equidistant from their neighbors.  And that sounds like a hexagonal grid.


And in fact, a hexagonal grid is the best way to divide a flat surface into equal-size regions.

The next step is to figure out how to represent a hex grid in my program.  I searched around for some guidance on how to best do this, and every link pointed back to Amit Patel's hex grid page.  Which is probably where I should have thought to start; it isn't a bad rule of thumb to check Red Blob Games first if you're looking for info on implementing a game mechanic.  Amit does a better job of explaining this than I can, so if anything seems unclear, go read his page.

The first choice I need to make is how to store the hexagonal grid.  The straightforward choice is to story it as a two dimensional array, but I need to be able to map the cells of the grid onto the array in a consistent way.  There are various choices (go read Amit's page) but I'm going to use what he calls odd-r:
The numbers in each cell of the grid represent the indices where the cell resides in the two dimensional array.  (This picture is stolen from Amit's page.  On his page it's interactive, and you should definitely go play with it.)

With that choice made, I now need to be able to map from the indices onto the hex grid.  For example, if I'm looking at the hex cell (3, 3), then what are it's neighbors?  If each hex cell is 5 pixels across, then what are the center coordinates for the (3, 3) hex cell?  And so on.  It might seem complicated to figure all this out -- which is why you'll be happy to know that Amit has already done it.  Have I mentioned you should go look at his page?

Assuming we can steal everything we need from Amit, what I need to do first is figure out how to layout the hexes over the map.  At this point I don't actually need to have the array, I can just pretend I have it and see where the hexes would be.  If I know the spacing of the hexes, I just divide the width of the map by the horizontal spacing to get the number of columns, and I divide the height of the map by the vertical spacing to get the number of rows and then draw a hex at each location:
Those hexes are much larger than I'll use for the wind model, but it shows that the layout is happening correctly.

Here I've exposed the edges of the map and drawn just the center hex and at the limits, to see if I'm really covering the whole map:
Top and bottom are off the map, but it doesn't really matter if I have some cells off the map as long as I don't miss part of the map, so this looks good.

The next step is to actually create an array for the hex grid and then map all the Delauney triangles to their corresponding hexes.  Since Javascript doesn't really support negative array indices, I need to shift the (0, 0) hex grid from the center of the map to the upper-left corner.  With that done, I walk through all the Delauney triangles and add them to the hex grid at their proper location.  I can check this by coloring in the hexes that contain land:
To determine if a hex is land, I'm averaging the height of all the locations that fall within the hex.  You can see that for some coastal hexes, the average is below zero even though there is some land.  An alternative is to use the maximum height of all the locations in a hex:
This overshoots in the other direction, marking a hex as land if it has any land.  Which is best depends upon what you're doing.

In either case, I can improve the accuracy by reducing the size of the hexes:
Now the shore is much better, but a new problem has arisen -- lots of inland hexes that aren't showing up as land. This happens because that when the hexes get small enough, some hexes don't have any Delauney triangles inside of them.  So they have no “height."  (This also illustrates the irregularity of the Delauney triangles.)

One solution is to take the height of the missing hexes to be the average of its neighbors, or the maximum of its neighbors.
In general, when the mapping from hexes to locations isn't at least one to one, some fix must be applied to fill in the missing information.

Now that I have a hex grid overlayed onto the map, the next step is to implement the wind model.  The basic idea of the wind model is simulate some winds (the trade winds) and propagate them across the map until they reach a steady state.  At the hex level (or location level, if I'm doing this on the Delauney triangles) this involves two steps:  (1) sum up all the winds entering this hex, and (2) determine how the summed wind leaves the hex.

The first step is fairly straightforward.  Each hex has six neighboring hexes, and each of those hexes can contribute wind.  If we treat each of the wind coming into a hex as a vector, then the total wind in the hex is the sum of those vectors, e.g., two winds of the same strength exactly opposite each other will cancel out.

The second step (determining how the summed wind leaves the hex) takes more thought.  The simplest case is a wind that blows straight across a hex:
In that case, we'd expect the wind to travel unchanged into the next hex.  (Here red is showing the original wind vector and blue the propagated wind vector.)

What about a wind that doesn't blow directly into an adjacent hex?
In this case, it seems reasonable that some of the wind should blow into the hex directly above, and some of the wind should blow into the hex counter-clockwise of that one, and the proportions should be based on where the arrow is pointing.  In this case, most of the wind will go into the hex directly above, and less into the adjacent hex.

There's also a choice to be made about the direction of the propagated wind.  One option is to maintain the direction of the source wind:

This seems like the most realistic choice, but another option is to change the direction of the wind to match the edge of the hex it crosses:
This is less accurate, but has the advantage that incoming winds will always be at one of six directions, which could simplify calculations.

A further complication arises when we consider terrain.  What should happen when there is a mountain in the way of the wind?
In this case, some of the wind goes up the mountain (possibly creating precipitation) but some of the wind is turned aside.
So how wind exits a hex depends upon it's direction as well as the terrain in the neighboring hexes.

Now let's talk about representing vectors.  There are two basic choices.  First, a vector can be represented by an X value and a Y value, like this:
If we draw the vector starting at (0, 0), then (X,Y) are the coordinates of the end points.  This representation makes it very easy to sum vectors.  You simply add together all the (X,Y) values to get a new vector:
An alternative representation is to use the angle and length of the vector:
With this representation, it is easy to do things like rotate the vector, or change it's length.

For most of what I need to do in the wind model, the first representation works well, but in some cases, the angle and length representation works better, so it may be convenient to be able to switch back and forth as necessary.  Rather than re-invent the wheel, I looked around for a Javascript vector library and Victor.js looks pretty good, so I'll use it.

I'll begin by dropping a wind vector into every hex and see if I can visualize that:
Looks good so far.  

The next step is to see if I can split a wind vector properly and propagate it into the next hex.  The first thing is to figure out the angles leading into other hexes.  Once again Amit's page provides the answer:
So a vector at 0 degrees points directly into the hex to the right, at 60 points into the hex below and to the right, and so on.  A vector that points in-between two of these directions gets split proportionally between the two hexes -- so a vector at exactly 30 degrees would get split equally between the hex to the right and the one down and right.  Every vector lies somewhere between the angles for two adjacent hex faces, so it's a matter of looking at the wind vector angle, seeing where it falls between the center angles of two hexes, and then splitting it proportionally between the two hexes.

For example, if a wind vector falls at 22 degrees:
then 38/60 is propagated into the hex to the right, and 22/60 percent of the vector is propagated into the the hex down and to the right.  If vectors are represented as an X and Y value pair, then you propagate by multiplying each value of the original vector by the proportion (e.g., 22/60) and then adding that into the wind vector in the new hex.

To test this, I can put winds at different directions coming in from the top and side of the map, and see if they get propagated properly across the map.  As the winds run into each other they should combine to take the average direction with increased velocity:
Here you can see the winds meeting along the diagonal and combining to blow down toward the bottom corner.

The next step is to take into account the effect of the land on the wind.  Real wind models are of course very complex, but my concern is primarily with how the surface winds are affected by the land geography.  At a simple level, this is just how the rise and fall of the land changes the direction and speed of the wind.  I experimented with a variety of different approaches, but in the end settled on two simple rules:
  1.  Wind turns away from obstructions.
  2.  Wind slows down when going uphill and speeds up when going downhill.
An obstruction happens when wind is blowing into a hex with a higher elevation, i.e., like a wind blowing towards a mountain.  When this happens, I'll look at the two hexes the wind is blowing into, and change the angle of the wind to be more towards the lower of the two hexes.  The amount the angle changes will vary depending on the height difference of the two hexes, so when a wind blows into two adjacent mountain hexes it won't change direction much, but if it blows into a mountain hex and a plains hex, it will swing strongly towards the empty hex:
How strongly the wind turns can be tuned.  The above map is probably too strong and would result in a lot of unrealistic biomes.  Here's a more reasonable value:
There's still a lot of wind movement based upon the terrain, but the big gaps and strong wind alleys have been tamed down a little bit.

Another feature that helps with realism is to add a little bit of spread to the wind.  For example, you can see in the above map the wind blowing due West just above the city of Breeches.  Although it blows quite a long ways, it never spreads out as we'd expect.  Where a blowing wind meets other air, it will tend to pull that air along with it.  To simulate this, I can take a little bit of the wind that is blowing in every hex and distribute it to all the neighboring hexes.  Here's what the above map looks like with a modest amount of spread:
You can see how the wind above Breeches has now start to spread downward.

That takes care of wind direction for the most part.  The second part is to slow down wind as it goes uphill and speed it up as it goes downhill.  I can accomplish this by looking at the relative height of the hex where the wind originates and the height of the hex where the wind is blowing, and adjust it faster or slower as necessary.

Here's what that adds:
You can see that some of the wind through the large mountains in the center part of the island has now been cut off.  Conversely, there are now some breezes on the western side of the island where air is flowing from the relatively high land down to the sea.  (An offshore breeze!  Although not really; that's a different mechanism.)

Now I can substitute the new wind into the existing precipitation algorithm.  Here's a side-by-side comparison (old winds on the left, new winds on the right):
(Click through for bigger version.)  Obviously there are differences between the wind models.  On both maps, the wind blows in from the east.  The mountains near the center of the map turn the wind there to the south, dropping a lot of precipitation and creating a swamp and forests just south of the mountains.  On the bottom part of the island the wind blows unimpeded and forests form along the eastern half of the island.  In the original wind model, enough wind comes over the center mountains and past the swamps to create a forest on the western side of the island.  With the new model most of the wind is cut off and grasslands form on the far side of the mountains.

The old model has a variety of random (within a range) parameters, and it's likely that some combination of those parameters would look more like the new map.  But it's not really important to reproduce the exact behavior of the old model, only to have a model that produces reasonable looking results.

The point of all this was to speed up and simplify the wind generation so I could add some new wind behaviors for continent-sized maps.  How did that work out?  I profiled the original wind model and the new hex-based model, and the hex-based model as about 15-20x faster than the original model (!).  A very significant speedup, with very little impact to the maps.  Some experimentation suggests that the model isn't very sensitive to the size of the hexes, either, so if necessary I can probably speed up the algorithm further by making the hexes bigger.

Next time I'll work on use the new wind model to implement some continental-scale wind patterns, and then hook that up to the precipitation model and biomes.

Monday, November 5, 2018

Continent Maps (Part 3): Land Shapes

With the various changes from the last posting implemented, I'm now able to generate worlds that are considerably bigger than previously -- up to at least 8x the size of the original worlds -- and save them as big image files:
(You can click through to see the full-sized 4800x2400 version on Flickr.)

I'm generating these maps using the same procedural generation for the region sized maps.  The map above has a pretty reasonable continent shape, and some interesting outlying islands. However, that's mostly luck.  Here's another map:
This map is just a mess of islands and a Swiss cheese landmass.

Here's another example, that's somewhere between the other two maps.  It's not entirely realistic, but it might be interesting for a fantasy setting:
This has a large continent land mass, but there are some pretty odd land shapes and overall doesn't look completely “real."  (Although that might be something some people want in a fantasy map.)  So what shape(s) should a “world" map have?

The majority of fantasy world maps I see depict either a large, island continent (with small islands around it), such as this map of Andelen:

Or an “arm" of a continent, as in this map of Angorun:
Occasionally there is a map that is all land, or several island continents, but these are rather the exception to the rule.

First, let me see about generating “island" continents.  As it turns out, DA already has a function that generates a large central island on a map, and it's aware of the map size as well, so it should work to create the main continent shape.  Some noise and secondary islands should take care of the rest.
(Sorry, no full-size versions of these examples.)  I wasn't expecting the big central sea on this map, but it's a fine surprise.  Here's another example:
One problem with the central island function is that it starts with a circle, which works fine on the square maps I've been showing, but not so well on maps that are rectangular.  (Following examples with low amounts of perturbation to show the basic shapes more clearly.)
That's easily corrected by masking the land with a (perturbed) ellipse taken from the map's dimensions instead of a circle:
These central islands are scaled to fill the map, but in many cases for continent-sized maps we'll want to leave some “border" around the continent.  Two parameters control how much the island fills the map in the X and Y directions.

Here's the same border control with more reasonable perturbation:
You can see that the east and west ends of the map remain ocean.  (This map has a larger view to click through.)  This means the map could show an entire world (and wrap from right to left) or if a portion of a world, could be connected to another map that also has ocean along the appropriate edge.

The keen-eyed who clicked through on the previous map will notice that the ocean and land patterns stop halfway across the map.  Previously I've only had 1x1 maps, and the ocean and land patterns were sized to fit on those maps.  With bigger maps I have to manually tile the patterns across the map, so I added that.  (SVG has a way to tile a pattern, but it has a bug in Chrome so I can't use it.)  This is a nice feature, because I can now use smaller land and ocean patterns and they'll tile automatically.  Not sure why I didn't think to implement this previously!

Now that island continents are working okay, let me move on to implementing “arm" continents -- maps where the continent comes into the map from the edge.
In this case, the continent wraps off on three of the edges.  But the primary feature of these sorts of maps is that there is a substantial land connection between the continent depicted on the map and land off the edges of the map.

The easiest way to ensure this sort of off-map connection is to set the sea level low during generation.  This increases the land area depicted on the map, which increases the chance that there will be a large land mass, and increases the chance that there will be land (and not sea) on the edges of the map.
Of course, that's not a guarantee that the land mass will be very interesting or even a single mass:
One way to create the semblance of a single continent is to use the same island continent generation I used above, but offset the island toward an edge of the map.  That gives us something like this:
You can see how the main continent is (primarily) a central island that has been shifted up and right.  Since this is a continent and doesn't need to retain a strict island shape, I can allow more perturbation of the shape as well.
Obviously there are (many!) other approaches to generating terrain but these two will at least give me the ability to generate the most common continent-sized land shapes.

The keen-eyed reader might have noticed the odd, stripey forest shapes on many of the continent-sized maps.  Next time I'll start tackling some problems in the wind and biome models that cause that problem.