Thursday, December 16, 2021

Map Compasses (Part 8): Radial Text

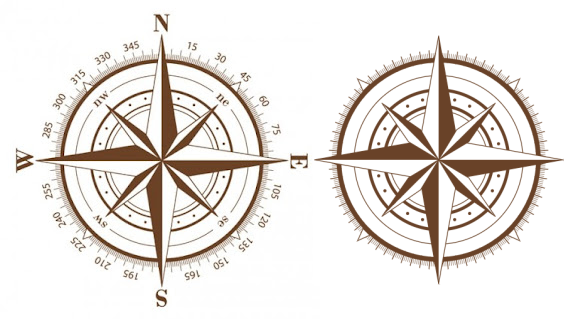
Welcome back to my blog series on procedurally-generated map compasses!  I've been implementing the Compass Design Language (CDL) and an interpreter for the language.  I've been measuring my progress (on the right) against this compass (on the left):

I've made good progress on the graphic elements of the compass, and now I'll tackle the labels.

Like the triangles, hash marks and compass points, the text in this example is a radial element that appears at intervals around the circle of the compass.  Unlike the previous radial elements, this element differs at every place, so our command will need to include a list of texts, one for each location around the compass.
RTEXT(start, repeats, font, size, color, style, weight, texts)
Start and repeat are the usual parameters for a radial element that defines where to start and how many repeats to place around the compass.  Font, size, color, and style are parameters that will define the font to use and its characteristics (e.g., italic, bold, etc.).  The final element is the list of texts to use, one for each repeat.  Most of these parameters are similar to what I've implemented in the parser for previous commands, but I've never tried to parse a list in Nearley so it will be interesting to figure that out.

To start with, I'll use brackets to delimit the list, and this will be a list of double-quoted strings:
# DQLIST
# A list of double-quoted strings, possibly empty
dqList -> "[" WS dqElements WS "]"
The elements can be nothing, a single double-quoted string, or a single double-quoted string followed by a comma and then more elements.  
# DQLIST
# A list of double-quoted strings, possibly empty
dqList -> "[" WS dqElements WS "]"
dqElements -> null
	      | dqstring 
	      | dqstring WS "," WS dqElements
You might (if you've taken any classes on grammars) have been discourage from writing rules like that last clause because it does “right recursion" -- that is, the last element in that rule loops back to the rule itself.  That causes problems in some grammar parsers, but it turns out that Nearley is fine with this.

The grammar above recognizes the list of texts but doesn't return the most useful values.  I'll fix that with some post-processing.
# DQLIST
# A list of double-quoted strings, possibly empty
dqList -> "[" WS dqElements WS "]" {% data => data[2] %}
dqElements -> null {% data => [] %}
	      | dqstring {% data => data %}
	      | dqstring WS "," WS dqElements {% data => [data[0], ...data[4]] %}
Mostly this should be familiar from previous blog entries -- the post-processing for all except the last clause just removes an unnecessary level of arrays.  The last clause is a little more interesting.  The three dots I use there is the spread operator, and essentially what it does is stick in the contents of an array.  (It “spreads" out the array so to speak.)  In this case, I use it to concatenate together the first element of the list (data[0]) and the list of all the remaining elements (data[4]).

With that defined we can create the rule for RTEXT:
# Radial text
# RTEXT(start, repeats, font, size, color, style, weight, texts)
rtextElement -> "RTEXT"i WS "(" WS decimal WS "," WS decimal WS "," WS dqstring WS ","
	     		        WS decimal WS "," WS dqstring WS "," WS decimal WS ","
				WS dqstring WS "," WS dqList WS ")"
                 {% data => ({op: "RTEXT", start: data[4], repeats: data[8], font: data[12],
                              size: data[16], color: data[20], style: data[24], 
                              weight: data[28], texts: data[32]}) %}
Now I add RTEXT to the interpreter in the usual way and create a function Draw.rtext that will do the work of drawing the text.

Perhaps not unsurprisingly, text is added to SVG by appending an SVG element, i.e., in D3 something like this:
    svg.append('text')
	  .attr('x', x)
	  .attr('y', y)
	  .style('font-family',font)
	  .style('fill', color)
	  .style('font-size', fontSize)
	  .style('font-style', fontStyle)
          .style('font-weight', fontWeight)
	  .text(text);
There are many possible attributes and styles that can be applied to SVG text elements but the above covers the ones we'll be using.

Let me start the implementation of rtext() by putting some text at noon.
function rtext(svg, center, radius, startAngle, repeats, angle, iteration, op) {
    let x = center[0];
    let y = center[1]-radius;
    svg.append('text')
	.attr('x', x)
	.attr('y', y)
	.style('font-family', op.font)
	.style('fill', op.color)
	.style('font-size', op.size)
	.style('font-style', op.style)
	.style('font-weight', op.weight)
	.text(op.texts[0]);
};
That results in this:
That worked, but it has placed the text so that the lower-left-hand corner of the text box is at the specified [x,y] location.  I'm okay with having the bottom of the text at the [x,y] location (or at least I think I am, that might change) but I think I'd prefer that the text be centered on that point.  To do this, SVG has a text-anchor attribute which I can set to “middle".
Now let's move on to the stickier issue of placing text somewhere other than 12.  I'd like to use the same “draw at 12 and rotate to the correct position" strategy I've used for most of the other radial elements, but text is obviously not a polygon that I can go through and rotate the points with math.  The good news is that SVG itself has a method for rotating text (and many other elements).  

SVG rotate is part of the SVG transform attribute, which also offers other transformations like scaling and translation (move).  The syntax for a rotate transformation is simple:
rotate(degrees, x, y)

This rotates an object by degrees around the point [x, y].  Let me add that to the rtext function:

function rtext(svg, center, radius, startAngle, repeats, angle, iteration, op) {
    let x = center[0];
    let y = center[1]-radius;
    svg.append('text')
	.attr('x', x)
	.attr('y', y)
	.style('font-family', op.font)
	.style('fill', op.color)
	.style('font-size', op.size)
	.style('font-style', op.style)
	.style('font-weight', op.weight)
	.style('text-anchor', 'middle')
	.attr('transform', 'rotate('+rad2degrees(angle-Math.PI/2)+','+center[0]+','+center[1]+')')
	.text(op.texts[0]);
};
Notice I needed a helper function “rad2degrees" because my angles are in radians and the SVG command expects degrees.

The other thing you might note is that the text at every compass point is “N".  That's because I'm just using text[0] in the SVG command.  What I need to do is use the text corresponding to which iteration of the label I'm currently writing.  That's the reason I've been passing in the iteration parameter:
function rtext(svg, center, radius, startAngle, repeats, angle, iteration, op) {
    let x = center[0];
    let y = center[1]-radius;
    svg.append('text')
	.attr('x', x)
	.attr('y', y)
	.style('font-family', op.font)
	.style('fill', op.color)
	.style('font-size', op.size)
	.style('font-style', op.style)
	.style('font-weight', op.weight)
	.style('text-anchor', 'middle')
	.attr('transform', 'rotate('+rad2degrees(angle-Math.PI/2)+','+center[0]+','+center[1]+')')
	.text(op.texts[iteration]);
};
And with that in place we can stress test the code:

I haven't fussed too much with matching the fonts, etc., but for the most part I'm able to recreate the labels.  One obvious problem is that the line isn't blanked out behind the ordinal labels -- I'll look at that and some other challenges next time.  (And see “Suggestions to Explore" below.)

A reminder that if you want to follow along from home, you need to download the Part 8 branch from the Procedural Map Compasses repository on Github and get the test web page up and open the console.  Part 1 has instructions, but the short version (on Windows) is to double-click mongoose-free-6.9.exe to start up a web server in the Part 8 directory, and then select the test.html link.  Obviously you can browse the code and other files, and make changes of your own.  You can also try out this code on the web at https://dragonsabound-part8.netlify.app/test.html although you'll only be able to run the code, not modify it. 


Suggestions to Explore
  • How would you address the problem of blanking out behind the ordinal labels?  One possibility is to have an radial rectangle element (“RRECT"?) and use it to draw white rectangles where the labels will be.  Can you use RRECT to draw the black and white ring in this compass?
    These rectangles aren't really rectangles -- they're arcs of a line instead.  How will you draw that?

  • In the example compass directly above, the cardinal labels are in the correct positions, but the text has *not* been rotated.  Implement a version of RTEXT that puts the text in the correct position but does not rotate the text.  For the rotated version of RTEXT, the “anchor" of the text was at the bottom center of the text.  Where should the “anchor" of the unrotated text be located?

  • In the stress test example above, I used the “Serif" and “Helvetica" fonts.  Both these are generally available in the browser.  What if you want to use a font that's not normally available?  How do you load a font into the browser and use it in SVG?  Can you write a CDL command that loads a font and makes it available?

Friday, December 10, 2021

Map Compasses (Part 7): Compass Points

Welcome back to my blog series on implementing procedurally-generated map compasses!  So far I've implemented the language and interpreter for circles, space, and radial lines, circles and triangles, as shown in this demo image below:

This time I'm going to tackle compass points.  These are the two-sided diamond-shaped elements that typically point out to the points of the compass:
Like the lines and triangles, the compass points are a radial element that repeats around the circle.  As in the example above, there are often multiple points, the largest pointing at the cardinal directions (N, S, E, W), a shorter set of points at the ordinal directions (e.g., NE), a shorter set still pointing at the secondary intercardinal directions (e.g., NNE) and so on.
Regardless of the number, these are all versions of the same basic shape set at different intervals around the compass.

Typically the compass points are shaded as in the two examples above -- split down the middle with the right side dark and the left side light.  This is probably a remnant of picturing the compass points as 3D with lighting coming from the same direction as on the map (i.e., typically from the NE) but has largely become stylized.  You do sometimes see compasses where the shaded and lit sides of the points switch to more accurately reflect the lighting, or where the lighting comes from a different direction, as in this example: 
But the more stylized version seems more common today, and that's what I'll implement (at least initially).

 Unlike the other radial elements, compass points always extend all the way to the center of the compass, so the overall length will be decided by that distance.  (Which I've called the radius.)  The distance from the tip of the point to the widest point of the diamond (which I'm calling the span) can be any value less than the radius, and the width is the width of the diamond at that point:
But the width can't be just any distance.  If the compass points are on top and visible, then we want the width to be so that the point just touches the adjacent point, as in the top points in this compass:
The width should never be greater than that, because that would result in asymmetry depending on the order in which the points are drawn.  Sometimes the width can be less, though, as in the points in this compass:
This could be drawn several ways, but in any case the width does not extend all the way to touch the neighboring points, so that there's a “gap" through which the other points show.

I don't want to have to calculate the proper width to touch the adjacent compass point, so I'll let the interpreter do all the hard work.  I'll specify the width of compass point as a percentage from 0 to 1, where 1 is the proper width to touch the adjacent compass point.  Using a value less than 1 will create a gap.  But to give myself a little flexibility in case I do want to specify the width, I'll treat any width value greater than 1 as an absolute width.

This seems like a handy approach, so I'll do the same with the span parameter, so that it can be expressed as either a percentage of the radius or a specific value.

Now let me define the point command.  In addition to the normal radial element parameters, I need to specify the span, the width, the line width and color of the outline, and the light and dark fill colors:
RPOINT(start, repeats, span, width, lineWidth, lineColor, lightFill, darkFill)
and here's the corresponding parse rule in Nearley:
# A radial compass point element
# RPOINT(start, repeats, span, width, lineWidth, lineColor, lightFill, darkFill)
rpointElement -> "RPOINT"i WS "(" WS decimal WS "," WS decimal WS "," WS decimal WS "," 
                                  WS decimal WS "," WS decimal WS "," WS dqstring WS "," 
                                  WS dqstring WS "," WS dqstring WS")" WS
                 {% data => ({op: "RPOINT", start: data[4], repeats: data[8], span: data[12],
                              width: data[16], lwidth: data[20], lcolor: data[24], 
                              lightFill: data[28], darkFill: data[28]}) %}
and the corresponding if-else clause in the interpreter:
	} else if (op.op == 'RPOINT') {
// Draw radial compass points Draw.repeat(svg, center, radius, op.start, op.repeats, op, Draw.rpoint); if (debug) console.log('Draw radial compass points.'); }
Now I have to write the code to actually draw the compass point.

As I did with the radial triangles, in order to simplify my calculations, I'll draw all the compass points aligned straight up and down, and then rotate them to their final positions.  The first step is to calculate the start and end of the diamond and the midpoint:
function rpoint(svg, center, radius, startAngle, repeats, angle, i, op) {
    let start = [center[0], center[1]-radius];
    let end = center;
    // Midpoint is the point on the center line where the
    // diamond will have its maximum width
    let midpoint;
    if (op.span <= 1) {
	// Treat span as a % of radius
	op.span = op.span*radius;
    };
    midpoint = [center[0], center[1]-radius+op.span];
Here you can see how I treat span as a percentage if it is <= 1.

Figuring out the width is a little more difficult, and requires some trigonometry.  I'm not very skilled at this sort of problem, but I have an approach that works for me -- I send it to my kids, who both have math degrees.  A few minutes later I get this back:
Here Î¦ (phi) is the angle between two adjacent compass points.  This isn't the “angle" that gets passed into RPOINT -- that's the orientation of the compass point being drawn.  Phi is calculated from the number of repeats that are being drawn -- if there are 4 repeats, then the angle between two adjacent compass points is 90 degrees (or PI/2 radians).  (This is why I've been passing in repeats even though I didn't need it in the previous radial elements.)
function rpoint(svg, center, radius, startAngle, repeats, angle, i, op) {
    let start = [center[0], center[1]-radius];
    let end = center;
    // Midpoint is the point on the center line where the
    // diamond will have its maximum width
    let midpoint;
    if (op.span <= 1) {
	// Treat span as a % of radius
	op.span = op.span*radius;
    };
    midpoint = [center[0], center[1]-radius+op.span];
    // The maximum width is one that just touches the adjacent point.
    // Phi is the angle between adjacent points.
    const phi = (2*Math.PI)/repeats;
    const maxWidth = Math.tan(phi/2)*(radius-op.span)*2;
Now I can calculate the two side points of the diamond using the midpoint and the maxWidth.  For testing purposes I can temporarily borrow some code from RTRI to rotate the points as necessary and draw the compass point:
function rpoint(svg, center, radius, startAngle, repeats, angle, i, op) {
    let start = [center[0], center[1]-radius];
    let end = center;
    // Midpoint is the point on the center line where the
    // diamond will have its maximum width
    let midpoint;
    if (op.span <= 1) {
	// Treat span as a % of radius
	op.span = op.span*radius;
    };
    midpoint = [center[0], center[1]-radius+op.span];
    // The maximum width is one that just touches the adjacent point.
    // Phi is the angle between adjacent points.
    const phi = (2*Math.PI)/repeats;
    const maxWidth = Math.tan(phi/2)*(radius-op.span)*2;
    // Calculate the two side points
    let side1 = [center[0]-maxWidth/2, center[1]-radius+op.span];
    let side2 = [center[0]+maxWidth/2, center[1]-radius+op.span];
    // Rotate the diamond points.
    start = rotate(center, start, angle);
    end = rotate(center, end, angle);
    side1 = rotate(center, side1, angle);
    side2 = rotate(center, side2, angle);
    // Draw the outline
    let p = [start, side1, end, side2];
    svg.append('path')
	.style('stroke-width', op.lwidth)
	.style('stroke', op.lcolor)
	.style('fill', 'none')
	.attr('d', lineFunc(p));
};
Which produces this:
Looks like it worked!

There are a couple of things left to do.  First of all, I need to calculate the actual width rather than always use the maxWidth, and use this width to calculate the side points of the diamond:
    // Calculate the actual width based on width
    if (op.width <= 1) {
	op.width = op.width*maxWidth;
    };
    // Calculate the two side points
    let side1 = [center[0]-op.width/2, center[1]-radius+span];
    let side2 = [center[0]+op.width/2, center[1]-radius+span];
As with span, we treat the width parameter as a percentage of the maxWidth if it is less than 1; otherwise we just use it as an absolute value.

Finally, the dark and light sides of the compass also need to get filled.  To do this I'll make two new polygons consisting of one side of the diamond and then a line to connect the start and end of the diamond.  I'll fill these with the provided colors and then draw the outline last so that it's on top.
    // Create and fill the left (light) side area
    const left = [start, side1, end];
    svg.append('path')
	.style('stroke-width', 0)
	.style('stroke', 'none')
	.style('fill', lightFill)
	.attr('d', lineFunc(left));
    // Create and fill the right (dark) side area
    const right = [start, side2, end];
    svg.append('path')
	.style('stroke-width', 0)
	.style('stroke', 'none')
	.style('fill', darkFill)
	.attr('d', lineFunc(right));
    // Draw the outline
    let p = [start, side1, end, side2];
    svg.append('path')
	.style('stroke-width', lwidth)
	.style('stroke', lcolor)
	.style('fill', 'none')
	.attr('d', lineFunc(p));
And that's basically it:
And now I can add compass points to my test compass recreation:
We're getting there!  Next time I'll tackle labels and then this example compass at least will be complete.

A reminder that if you want to follow along from home, you need to download the Part 7 branch from the Procedural Map Compasses repository on Github and get the test web page up and open the console.  Part 1 has instructions, but the short version (on Windows) is to double-click mongoose-free-6.9.exe to start up a web server in the Part 7 directory, and then select the test.html link.  Obviously you can browse the code and other files, and make changes of your own.  You can also try out this code on the web at https://dragonsabound-part7.netlify.app/test.html although you'll only be able to run the code, not modify it. 

Let me know in a comment or an email if you're making use of the code at all!

Suggestions to Explore

  • I've only implemented the standard “dark on the right" color scheme for compass points.  You can easily implement “dark on left" by swapping the fill colors in the RPOINT command.  Shading based on the light direction is more challenging.  Extend the code to add “shaded based on the lighting direction" as discussed above.  Add a parameter to the RPOINT command to indicate whether to shade “fixed" or a number that represents the angle of lighting in degrees.  How do you handle a parameter where the value can be a string or a number?

  • In the example compass, the ordinal compass points are smaller and sit “between" the cardinal compass points.  If the widest point of the ordinal compass points doesn't land exactly on the cardinal compass points, the compass looks wrong:

    I made the example work by trial-and-error to get the correct values for the span and width of the ordinal compass points.  That won't work when I'm using procedural generation.  How would you change the code to avoid this trial and error?

  • Several of the example compasses in the repository shade the points using lines, as in this example:

    How would you implement this?


Thursday, December 2, 2021

Map Compasses (Part 6): Radial Triangles

Welcome back to my blog series on implementing procedurally-generated map compasses!  So far I've implemented the language and interpreter for circles, space, and radial lines and radial circles.  Let's see what other capabilities we'll need to draw some compasses:

I can already do a surprising amount of this compass.  There are only three things left to do:  the triangles that mark the 45 degree angles, the two-toned diamonds that form the arms of the compass, and the labels.  I'll start with the triangles.

Radial triangles are a like radial circles with one important distinction:  they're not symmetrical.  When I drew the radial circles, the angle where I drew them was unimportant, since circles are symmetrical and look the same no matter how they are rotated.  That's not going to be true for triangles.  I'll have to rotate them to match the angle at which they are drawn. 

Initially this seems a little daunting.  I can figure out the math to draw a triangle pointing North.  But figuring out how to draw one pointing NE (or some other random angle) is going to take some thought.  Fortunately for me, there's a simpler workaround:  draw the triangle pointing North and then rotate it around the center of the compass to the desired angle.

I'll start by defining a command for radial triangles:
RTRI(start, repeats, height, width, lineWidth, lineColor, fillColor)

This is similar to RCIRCLE, although here I need both a height and a width.  (All the radial element commands will start with R.)  And here's the Nearley rule to parse that:

# A radial triangle element
# RTRI(start, repeats, height, width, lineWidth, lineColor, fillColor)
rtriElement -> "RTRI"i WS "(" WS decimal WS "," WS decimal WS ","
	       	       	      WS decimal WS "," WS decimal WS ","
			      WS decimal WS "," WS dqstring WS ","
			      WS dqstring WS ")" WS
{% data => ({op: "RTRI", start: data[4], repeats: data[8],
   	   	 	 height: data[12], width: data[16],
			 lwidth: data[20], color: data[24],
			 fill: data[28]}) %}
Now I have to add an if-else clause to the interpreter to pick up this operator and call a handler function:
	} else if (op.op == 'RTRI') {
// Draw radial triangles Draw.repeat(svg, center, radius, op.start, op.repeats, op, Draw.rtri); if (debug) console.log('Draw radial triangles.'); }
And so the signature of the rtri function is:
function rtri(svg, center, radius, start, repeats, angle, i, op)
Which is the same signature as all the radial element functions.  Just a reminder of these parameters:  Center is the center of the compass.  Radius is the distance from the center to the base of the triangle.  Start is the starting angle for the repeats.  Repeats is the number of repeats around the compass.  Angle is the angle of this repeat.  I is which iteration of the repeats this call is.  And op is the original RTRI command.
In the radial line element, height was measured down towards the center of the compass.  I'll keep a consistent interpretation of height here, but I expect most triangles will point away from the center, meaning they'll have a negative height.  So this means that the end point is just the triangle height closer to the center.
Here's a diagram that will hopefully clarify (remember I'm drawing all the triangles as if they point North):
Both start and end are directly above the center point.   Here are the calculations for that:
    function (svg, center, radius, start, repeats, angle, i, op) {
        const start=[center[0], center[1]-radius];
        if(op.height==0) op.height = radius;
        const end=[start[0], center[1]-radius+op.height];
    };
However, this isn't quite what I want.  The start point is in the center of the base of the triangle, so I don't actually need that.  What I need are the points to the left and right, like this:
Updated:
    function (svg, center, radius, start, repeats, angle, i, op) {
        const left=[center[0]-op.width/2, center[1]-radius];
        const right=[center[0]+op.width/2, center[1]-radius];
        if(op.height==0) op.height = radius;
        const end=[start[0], center[1]-radius+op.height];
    };
I'm going to pause here and use the line drawing function to draw this triangle and make sure I've got everything right.
    function (svg, center, radius, start, repeats, angle, i, op) {
        const left=[center[0]-op.width/2, center[1]-radius];
        const right=[center[0]+op.width/2, center[1]-radius];
        if(op.height==0) op.height = radius;
        const end=[start[0], center[1]-radius+op.height];
        line(svg, left, right, op.lwidth, op.color);
        line(svg, right, end, op.lwidth, op.color);
        line(svg, end, left, op.lwidth, op.color);
    };
Looks good!  Now let me tackle rotating the triangle to the proper location.
To do this, I need to rotate all the points in the triangle around the center of the compass by angle.  Right now I have the points as left, right and end, which is not very convenient.  I'll modify rtri to create an array of the triangle points:
function rtri(svg, center, radius, start, repeats, angle, i, op) {    
    if (op.height == 0) op.height = radius;
    let triangle = [[center[0]-op.width/2, center[1]-radius], 
		    [center[0]+op.width/2, center[1]-radius],
		    [center[0], center[1]-radius+op.height]];
line(svg, triangle[0], triangle[1], op.lwidth, op.color); line(svg, triangle[1], triangle[2], op.lwidth, op.color); line(svg, triangle[2], triangle[0], op.lwidth, op.color); };
Now I need a function to
rotate a point through an angle
.  In Javascript, that looks like this:
//
//  Rotate p2 around p1 by angle (in radians)
//
function rotate(p1, p2, angle) {
    let cos=Math.cos(angle),sin=Math.sin(angle),
        nx=(cos*(p2[0]- p1[0]))-(sin*(p2[1]- p1[1]))+ p1[0],
        ny=(cos*(p2[1]- p1[1]))+(sin*(p2[0]- p1[0]))+ p1[1];
    return[nx, ny];
}
I need to apply this function to all the points in the triangle array.  There are various ways to do this in Javascript -- a for loop is an obvious choice -- but Javascript has a feature specifically for this sort of operation, called map.  Map takes an array and a function and returns a new array that results from applying the function to every element in the list.  Now I can't just map the rotate function directly, because the arguments won't be right.  So I need an arrow function to fix that up.
function rtri(svg, center, radius, start, repeats, angle, i, op) {    
    if (op.height == 0) op.height = radius;
    let triangle = [[center[0]-op.width/2, center[1]-radius], 
		    [center[0]+op.width/2, center[1]-radius],
		    [center[0], center[1]-radius+op.height]];
    triangle= triangle.map(pt => rotate(center, pt, angle));
    line(svg, triangle[0], triangle[1], op.lwidth, op.color);
    line(svg, triangle[1], triangle[2], op.lwidth, op.color);
    line(svg, triangle[2], triangle[0], op.lwidth, op.color);
};
For every pt in triangle, the map function calls “rotate(center, pt, angle)" and collects the results in a new list (which gets put back into triangle).
And now every triangle gets drawn at the proper spot.  All that remains is to fill in the triangle.  To do that, I have to draw the triangle differently.  Right now I'm drawing it as three separate lines, which means there's no “inside" to fill.  I need to draw it as connected lines.
There are a couple of ways to do this in SVG, but I typically use an SVG path.  SVG paths are a bit of a nightmare if I'm being honest, but they're very flexible and can be used in ways that simpler methods don't allow.  And here again D3 will come to our rescue with several powerful methods for constructing SVG paths.  Principally I use d3.line, which is a function that creates a function that turns a polygon into the commands expected in the SVG path command.  (Whew!)  
In practice, it's not too difficult to understand:
    const lineFunc= d3.line().
                        x(pt=> pt[0]).
                        y(pt=> pt[1]).
                        curve(d3.curveLinearClosed);
This creates a function called “lineFunc" that takes a list of points.  In x and y I define how you get the x and y values out of a point.  In this case, points are arrays like [x, y], so the x value is the first element of the array and the y value is the second element of the array.  Curve is used to specify how points are connected.  In this case, I want to use straight lines between the points and I want to draw a closed polygon that connects the last point back to the first point.  D3 itself provides a curve function that does that, called d3.curveLinearClosed.  D3 provides a bunch of different curves you can use to connect points -- you can
explore some here
.
With lineFunc defined, the code to draw the triangle as a path instead of three separate lines is simple:
function rtri(svg, center, radius, start, repeats, angle, i, op) {    
    if (op.height == 0) op.height = radius;
    let triangle = [[center[0]-op.width/2, center[1]-radius], 
		    [center[0]+op.width/2, center[1]-radius],
		    [center[0], center[1]-radius+op.height]];
    triangle = triangle.map(pt => rotate(center, pt, angle));
    svg.append('path')
	.style('stroke-width', op.lwidth)
	.style('stroke', op.color)
	.style('fill', op.fill)
	.attr('d', lineFunc(triangle));
};
The only non-obvious part is passing the output of lineFunc into the “d" attribute.  (I have no clue why it is called that.)
And now a little bit of a stress test:
I haven't bothered to get this exactly right, but we're a long ways towards generating a pretty complex and interesting compass.  And SVG path will come in handy next time when I tackle the compass points.
Just for fun, here's the CDL to generate the partial compass above:
RLINE(0, 72, 8, 0.5, "rgb(108,65,38)")
SPACE(2)
RLINE(0, 360, 4, 0.25, "rgb(108,65,38)")
SPACE(3)
RTRI(0, 8, -8, 6, 0.5, "rgb(108,65,38)", "white")
CIRCLE(3, "rgb(108,65,38)", "none")
SPACE(8)
CIRCLE(0.5, "rgb(108,65,38)", "none")
SPACE(8)
CIRCLE(2, "rgb(108,65,38)", "none")
SPACE(4)
RCIRCLE(0, 24, 1, 0, "none", "rgb(108,65,38)")
SPACE(4)
CIRCLE(2, "rgb(108,65,38)", "none")
SPACE(2)
CIRCLE(0.5, "rgb(108,65,38)", "none")
And this shows how to input an arbitrary RGB color in CDL.

A reminder that if you want to follow along from home, you need to download the Part 6 branch from the Procedural Map Compasses repository  on Github and get the test web page up and open the console.  Part 1 has instructions, but the short version (on Windows) is to double-click mongoose-free-6.9.exe to start up a web server in the Part 6 directory, and then select the test.html link.  Obviously you can browse the code and other files, and make changes of your own.  You can also try out this code on the web at https://dragonsabound-part6.netlify.app/test.html although you'll only be able to run the code, not modify it. 

Suggestions to Explore
  • The RTRI code is the basis for any sort of polygon.  Try implementing diamonds, or for the adventurous, star shapes.

  • Try re-implementing RLINE using the method in RTRI of drawing the line at noon and then rotating it to the proper position.  If you implemented RCROSS in Part 5, try re-implementing it using the draw and rotate approach.  Is that easier/better?