
The first step in getting to this goal is to be able to draw a line. I like to set my sights high.
This makes it very easy to draw a line in SVG. You just have to provide the start and end point of the line, and the browser takes care of figuring out how to draw from start to end.

Believe it or not, that's actually a screen shot of a line drawn with SVG. This blog spares no expense in bringing you high quality content.
Drawing a (simple) mountain shape is then just a matter of drawing the appropriate lines:

One obvious problem is that the lines are too perfect -- razor straight and precise in a way that only a computer can manage. I'd like to have lines that look more natural, with the kinds of imperfections one sees in hand-drawn lines.
As it happens, there was an effort a few years ago to create plots in Python that would look like the hand-drawn plots Randall Munroe uses in XKCD.
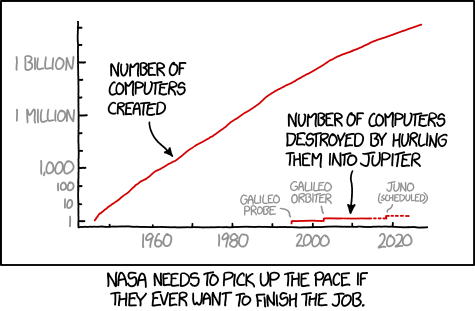 |
Here's an example of a plot created by the Python code:

I think it does a pretty good job of making the lines look hand-drawn. Even better, some benighted soul ported the Python code to Javascript and D3, so stealing the code for my own purposes is pretty trivial.
The key element of the code is a function called xinterp that takes a polyline represented as an array of points and interpolates it into a new line with jitter. The code does a couple of clever things with adding the jitter. First, the line is initially scaled into a standard coordinate system. This keeps the magnitude of the jitter independent of the original coordinates. Second, the jitter is applied in a direction normal to the gradient of the line. This makes the jitter a natural "side to side" wobble regardless of the orientation of the line. Here is an example of a jittered line:


With that fix in place, I can draw the same simple mountain shape using the "hand-drawn" lines. Here's an example along with the original mountain for comparison:

Another feature of hand-drawn lines is the width of the line tends to vary. That's a bit of a challenge in SVG because the width of a line cannot change. So to draw a line with changing width, you have to split the line up into pieces and draw each piece a different width. If you use a fairly small increment of change in width (around a quarter point works well for me) the line appears to be smoothly changing. I have some experience of this because Dragons Abound can already draw rivers that smoothly grow in width as they flow toward the coast:

To start with, I'll create a line that smoothly varies between two widths. Here's a comparison of three lines: The first a standard SVG line, the second a "hand-drawn" line and the last a hand-drawn line that starts with a 3 point width and narrows to 1.5 points width at the end.

A narrowing line of this sort is typical in hand-drawing where the artist reduces the pressure of the pen as he makes a stroke.
Here's an example of the hand-drawn mountain with the narrowing lines, and a comparison to the previous versions:

And another example, with denser shading:

Another obvious variant is to let the width of the line change semi-randomly. In this case, I chose to let the width of the line increase or decrease by a quarter point at random intervals. Here's a comparison of four lines: The first a standard SVG line, the second a "hand-drawn" line, the third a hand-drawn line that starts with a 3 point width and narrows to 1.5 points width at the end, and the fourth a hand-drawn line that varies between 1.5 and 3 points in width:


ADDENDUM
After writing this blog post, I reorganized my approach to this code. Although the XKCD-inspired code works well for creating plots, it has a couple of issues for my use.
First, the original code assumes straight lines. In my case, I often use D3js's capabilities to draw smoothly curved lines, and this breaks the original code in some ways that I'll describe in a future blog posting. One of the fixes is to be able to break any line down into smaller component lines (resampling) rather than just straight lines. Resampling a curved line is non-trivial, but one approach that works in SVG is to actually draw the curve and then use the browser's built-in capabilities to step along the curve and resample. This is not particularly efficient, but it is very general.
Second, the original code goes to some pains to scale the jitter independent of the scale of the graph axes. This has some problems (namely, you really want to scale the jitter by the displayed size of the lines) and in my case is at any rate irrelevant because I already know the scale of my map. So I have modified the code to simply take a magnitude for the jitter -- it's up to the user to pick an appropriate level of jitter.
The code for resampling, jittering and creating a hand-drawn line can be found in this gist.
I have been working as a vector artist at Vector Design Company and doing vector drawing by using adobe illustrator. You can see my line drawing works at https://www.vectordesign.us/vector-line-drawing/ Thanks for your nice post.
ReplyDeleteFYI, your links in this sentence: "Even better, some benighted soul ported the Python code to Javascript and D3, so stealing the code for my own purposes is pretty trivial." now lead to a dead page taken over by a spam page.
ReplyDeleteThanks for the heads-up! It looks like he moved his pages to dmf.io, so I've updated the links accordingly
DeleteTangentially related, here's a little exploration of creating hand-drawn (imperfect) circles in SVG http://bl.ocks.org/patricksurry/11087975
ReplyDelete