Wednesday, November 30, 2016

More Scribbles

In the last posting, I described the process Dragons Abound uses to create scribbles, as shown in this example:
In this posting I'll talk about making these scribbles more natural looking.  I'll use my usual simple mountain as an illustration:
The first refinement I want to try is to make the lines of the scribble into gentle arcs.  When people scribble lines back and forth, they typically pivot their drawing hand around their wrist.  As a result,  they draw shallow arcs rather than straight lines. 

To make each segment of the scribble into an arc, I will add a new point at the midpoint of the segment, and offset that midpoint a short distance along the perpendicular to the line:
The new (blue) line from `P_0` to `P_1` passing through `M'` will then form a shallow arc (because I'm using D3's ability to interpolate between points on a polyline with smooth curves).  One point to note here is that every other stroke of the scribble I have to swap the offset from side to side.  This is necessary because the first stroke goes up from bottom to top (in the Y direction) and the following stroke comes down from top to bottom.  It's also a good idea to scale the offset based upon the length of the stroke, or short strokes will have a stronger curve than long strokes.

Aside:  As I was working on this I discovered a bug in the code I borrowed from the XKCD plot in Javascript.  I fixed that problem, sent a patch off to the author, and then found a problem in my code that had apparently been masked by the problem in the other code (!).

Here's a comparison of the original straight stroke to a (strongly) curved stroke:
And here's a version with slightly less curve and the hand-drawing jitter turned on:
This doesn't look good.  There's a kink in the middle of each arc, particularly noticeable in the longer lines.  What's going on here?

Remember when I said the arc was created using D3js's curve interpolation?  It made a smooth arc between the three points defining each stroke, because there was a lot of "room" between the points to fill in a curve.  But when I turn on hand-drawing jitter, those three points are interpolated into many points, much closer together.  And since those points are fixed, D3js's curve interpolation can't move them to make a smoother curve.

The solution is to do the curve interpolation first, and then the jitter interpolation.  Unfortunately, D3js doesn't provide any (easy) way to do this.  After an email exchange with Mike Bostock, it looks like the best approach is to draw the original curve, and then interpolate it by measuring along the curve and sampling points. These points can then be jittered to make a new line.  Here's the arc+jitter version along with the straight and the arc versions:


It's a minor difference at this step but worth keeping.

The next refinement I want to implement is to break up the regularity of the distance between the scribbles.  I'll do this by varying the step size as I sweep the finder line through the polygon.  I randomly offset the step size by up to half the step size smaller or larger.  Here's an example alongside the previous versions:
Now the scribbles vary in spacing, but the upward strokes all have precisely the same angle.  I can address that by varying the angle `mu` of the finder line as it steps through the polygon.  I'll also turn on the code the varies the width of the line.  Some examples:
And some denser examples, probably more similar to what I might use on a map:
(The densest of these takes about 3 seconds to render on my desktop machine, by the way.)

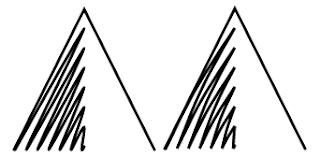
One problem with the examples above is that the shading precisely fills a very regular shading area -- this is particularly glaring in the denser examples.   The shading area is defined as the left side of the triangle:
I can make the outline of the shading area less precise using the same perturbation that I use for making hand-drawn lines -- here's what that looks like with increasing amounts of perturbation:

You can see by the last example the perturbation is pretty extreme -- that looks like a shading area as drawn by a drunken Picasso.  Somewhere around the third example looks right to me -- here's what mountains look like when shaded with that level of perturbation:
That looks better than the very precise shading area, but notice that the shading area now sometimes goes outside of the mountain.  That's not entirely unpleasing, but that rarely (if ever) happens in the hand-drawn examples I've looked at.  So I'd like to modify the perturbations so that they can only go inward.

The perturbations in the hand-drawn line code come from this:

// Generate some perturbations. 
var perturbations = smoothLine(points.map(d3.randomNormal()), 3);
The function d3.randomNormal generates numbers with a mean of 0 and a standard deviation of 1.  It turns out that if you are perturbing a polyline that is in counter-clockwise orientation, the negative numbers perturb the line inward and the positive numbers perturb the line outward.  So to perturb only inward, I can just use the negative numbers.  (And ensure my polyline is in counter-clockwise orientation!).  This is the result:
 You can see that the shading now generally avoids going "outside the lines".  As the last two examples show, it can still happen in sharp corners -- because the inward perturbation actually pushes the line back so far it crosses back over the other line, creating a pocket outside the shading area, e.g.,
I don't see offhand any straightforward way to deal with this, so I'll just live with it for the moment.  It may be that when I get around to creating the shading area for real, I'll use some better approach to perturb it and this feature won't be needed for shading anyway.

So I'm now able to make a "hand-drawn" line and scribble within an area.  In the next posting, I'll start looking at creating a more convincing mountain shape than the simple triangle I've used so far.

Sunday, November 27, 2016

Scribbled Notes

In a previous posting, I described how Dragons Abound make lines that look hand-drawn, and showed these examples:
One thing that still looks unnatural about these mountains is that the shadowed sides are too precisely shaded.  Although the shading lines themselves have a hand-drawn quality, it looks more like technical drawing than hand-drawing.  The precise outline caused by clipping the lines to the shadowed area also doesn't look good, particularly in contrast to real hand-drawn examples:

In these examples, the shading is drawn in with scribbles -- back and forth lines at roughly the angle of the mountain that do not adhere precisely to the shape of the shaded area.  This sort of scribbled shading is something I'd like to have in Dragons Abound.  To be honest, I really don't have any notion of how to implement this, so this posting will be more of a chronicle of my development process than a finished project.  I apologize in advance if it all comes to nothing. :-)

The first thing I do, of course, is to Google around and see if I can find an algorithm I can steal or adapt.  But it's pretty difficult to find any information on how to fill an arbitrary polygon with scribbles.  Apple actually has a patent on a method, but to be honest I don't think much of the approach.  Adobe Illustrator has a scribble effect, but that doesn't help me for obvious reasons.  I've put out a call for help on /r/GraphicsProgramming, so maybe that will yield results, but in the meantime I'm going to have to roll my own.  In general this seems like a pretty hard problem, but you can follow along and see how far I get.

To start with, I'm going to look at filling a simple triangle shape:
Often I tackle a problem like this by figuring it out for a simple case.  Sometimes that leads to insights that let me tackle the harder cases.  Sometimes it turns out that the simple case is good enough for what I need.

When I shade something like this by hand, I draw lines back and forth at roughly the angle of the hypotenuse of the triangle and slide my hand backward along the paper until I've filled the triangle.  So I'll try to implement a similar approach in software.  My general idea is to slide a "finder" line at the basic slant of the scribbles along in the x dimension and identify a sequence of points where the line intersects the shape:
These points are where my pencil turns around when shading by hand.  As you can see, at each step the line intersects the shape in two places.  The scribble is created by going back and forth between the points of intersection:
That looks like it could work -- at least for a convex polygon.  What happens if I don't have a convex polygon?
Here's a concave polygon.  In this case, the finder line intersects in four points instead of two.  In general, an infinite line should intersect the polygon in an even number of points.  (If the line intersects in an odd number of points, it means that one end of the line is inside the polygon.  [But see below for another case I figured out later in the process.])  In this case, I think I can draw two scribbles -- one for the first pair of points and one for the second pair of points.  (I'll probably have to sort the points by their Y value to keep the two pairs correct as the finder line slides along.)

At some point the number of intersecting points goes back to two.  At that point, I can stop drawing one of the lines and finish with the other.
It might be that continuing a line when the number of pairs changes creates problems, but if so a fallback option is just to start new scribbles whenever the number of intersection pairs changes.

Going the other direction -- from one pair of points to two pair -- is similar:  Continue the existing line and start a new line for the second pair of points.  

I can imagine nasty situations where all of this might break down, but I think I'll just push ahead and see how well this works in practice.

The first step in actually implementing this is to define the finder line.  The slope `mu` of the finder line will be specified by the user.  For intersecting with the polygon, it's handy to have the finder line in two point form:  `(x_s, y_s)` and `(x_e, y_e)`:
For the reason mentioned above, I need these points to be outside the polygon.  This can be accomplished by finding the minimum and maximum `y` values for the end points of the line segments in the polygon and then setting `y_s = y_min` and `y_e = y_max`.

Having defined `y_s` and `y_e`, the next problem is to figure out the range on the `x` axis where I am going to slide the finder line.  Ideally, I only want to slide the line through the points where it could actually intersect with the polygon.  It should be obvious that the first point of contact between the finder line and any polygon will be one of the vertices of the polygon:
To find the range on the `x` axis to slide the finder line, I need to intersect the finder line with each vertex of the polygon, project the finder line down to `y_s` and then find the minimum and maximum values for `x` in those projected points.  How do I do that?

Given the slope of the finder line `mu` and the coordinates of the vertex (`x_1`, `y_1`), I want to find the intersection of the finder line with the horizontal line `y_s`:

A little algebra shows that the point `x_i` is given by the equation:

`x_i = x_1 - (y_s-y_1)/mu`

The range of `x` values for sweeping the finder line can then be found by calculating `x_i` for each vertex in the polygon and keeping the minimum (`x_min`) and maximum (`x_max`) values.  At this point, I now have the slope `mu` of the finder line, the two horizontal lines that bracket the top and bottom of the polygon (`y_s` and `y_e`) and the range of `x` values to try (`x_min` to `x_max`).

Now that I have the finder line defined, how do I determine where it intersects with the polygon?  The straightforward approach is to intersect the finder line with each line segment in the polygon.  A trip to StackOverflow yields a Javascript function to intersect two lines in two-point form, which I have modified slightly here to correct a typo and to work specifically on line segments:

function line_seg_intersect(x1, y1, x2, y2, x3, y3, x4, y4)
{
    var ua, ub, denom = (y4 - y3)*(x2 - x1) - (x4 - x3)*(y2 - y1);
    if (denom != 0) {
       ua = ((x4 - x3)*(y1 - y3) - (y4 - y3)*(x1 - x3))/denom;
       ub = ((x2 - x1)*(y1 - y3) - (y2 - y1)*(x1 - x3))/denom;
       if (ua >= 0 && ua <= 1 && ub >= 0 && ub <= 1) 
         return [x1 + ua*(x2 - x1), y1 + ua*(y2 - y1)];
    };
    return null;
}

Now I can sweep a line over a polygon and find all of the intersections with the polygon:
One problem I encountered in running a few test cases is that sometimes this finds the same intersection twice.  This happens when the finding line exactly intersects a vertex of the polygon.  In that case, the the line intersects with both of the sides of the polygon that meet at the vertex (since they share that point), and the vertex point ends up getting added twice.  That's fixed by checking for duplicates before adding to the list of intersections.

After making sure that the intersection points in each step of the sweep are sorted by the y axis, I can then draw a line connecting all the points:
And a test with a different slope:
So far so good! Let's see what happens with a more complex polygon.
This test turned up another edge case:  Sometimes the finder line only intersects the polygon at one point.  This happens when the finder line intersects the polygon only a corner vertex.  As noted above, that produces two intersections, but they're both the same point, so the fix above that prevents duplicate points eliminates one of them, leaving just a single point of intersection. The fix is to just ignore the single intersection cases -- these points are always in a corner and drawing a line to them would run along the border of the polygon and look bad in any case.

Let's try a concave polygon:
Not so good.  You can see there's a spot with two pairs of points and that the scribble is messed up there.  (I haven't yet implemented the logic to handle more than two intersection points.)  Also notice how the line ends in the upper corner.   Sweeping the finder line with equidistant points doesn't mean the scribbles will be even spaced, because the scribble points are on lines with different slopes.  I hope that when using narrower, more packed scribbles this sort of problem won't be too noticeable.  In the meantime, let me see about the concave polygon problem.

To address this, I have to keep track of how many intersection points are being found on each sweep, and when that number changes, add new paths if it gets bigger, or retire existing paths if it gets smaller.  After that change:
You can see that there's now an orphaned one segment "scribble" where the concave intrusion broke up the main scribble path.  If I increase the density of the scribble lines and zoom in a bit, you can see the secondary path is now longer:
Let's try it with a different slope:
Darn it.  I suspect the problem here is that the wrong path is being continued.  I'd like to keep a long continuous path if possible, but when going from one to two paths or vice versa I don't see any obvious logic for which path to keep and which to drop.

As I mentioned earlier, the alternate approach is to restart all the paths whenever the number of paths changes.  Let me try that:
That fixed it!  The break is more obvious now, but at the scale I'll be using on maps I don't think it will be noticeable.  How about a more challenging example?
Not bad.  And the opposite slope?
Note that there are a bunch of scribbles that are just single straight lines because the number of intersection points keeps changing as the finder line is swept through the middle of the polygon.

However, there is an angle where the algorithm breaks down:
It wasn't immediately obvious to me what happened here, but after some analysis I realize that  the problem occurred where the scribble switches from two paths to two different paths.  Normally the algorithm notices that the scribble is on new paths because the number of paths have changed.  But in this case it can't tell, because the number of paths is the same.  I don't think this is likely to happen often (or even at all) in my case, so I'm not going to put any big effort into fixing it right now.

This posting has gotten long, so I'm going to break here and tackle making the scribbles look more hand-drawn next time.  However, I did do a "quick and dirty" version and used it to shade my simple mountains, just to get an idea of whether this effort is even worth it:
This has more of a the flavor of an architectural drawing than I'm eventually aiming for, but I actually like the way it looks.  At any rate, I think it shows that this approach has some promise for producing scribbles that look realistically hand-drawn!

Tuesday, November 22, 2016

This Is Where I Draw the Line

Having covered in some detail the world-building aspects of creating mountains, I'm now going to spend some time on how to draw mountains on the map, taking my inspiration from hand-drawn examples such as these:
The first step in getting to this goal is to be able to draw a line.  I like to set my sights high.

Dragons Abound draws maps using "Scalable Vector Graphics" aka SVG.  Unlike the more familiar raster graphics, vector graphics don't represent images as arrays of colored dots (pixels) but rather as a set of shapes.  The web browser (or whatever program displays the SVG) is responsible for figuring out how to translate the shapes into actual pixels for you view.

This makes it very easy to draw a line in SVG.  You just have to provide the start and end point of the line, and the browser takes care of figuring out how to draw from start to end.
Believe it or not, that's actually a screen shot of a line drawn with SVG.  This blog spares no expense in bringing you high quality content.

Drawing a (simple) mountain shape is then just a matter of drawing the appropriate lines:

Kind of a boring mountain, but you get the idea.

One obvious problem is that the lines are too perfect -- razor straight and precise in a way that only a computer can manage.  I'd like to have lines that look more natural, with the kinds of imperfections one sees in hand-drawn lines.

As it happens, there was an effort a few years ago to create plots in Python that would look like the hand-drawn plots Randall Munroe uses in XKCD.

https://xkcd.com/1727/

Here's an example of a plot created by the Python code:

I think it does a pretty good job of making the lines look hand-drawn.  Even better, some benighted soul ported the Python code to Javascript and D3, so stealing the code for my own purposes is pretty trivial.

The key element of the code is a function called xinterp that takes a polyline represented as an array of points and interpolates it into a new line with jitter.  The code does a couple of clever things with adding the jitter.  First, the line is initially scaled into a standard coordinate system.  This keeps the magnitude of the jitter independent of the original coordinates.  Second, the jitter is applied in a direction normal to the gradient of the line.  This makes the jitter a natural "side to side" wobble regardless of the orientation of the line.  Here is an example of a jittered line:
As you can see it looks at least somewhat more hand-drawn.  But if I overlay the jittered line on top of the original line, a problem becomes apparent:
You can see that the black jittered line doesn't match up with the blue line at the ends.  This isn't a problem in creating plots, because they're all unconnected lines.  But it is a problem for me, because in some cases I will want to draw separate jittered lines and have them connect.  The fix is avoid adding jitter to the start and end points.  Occasionally this creates a little "hook" at the end of a line where a lot of jitter has to be eliminated, but as long as the magnitude of the jitter is kept small this is a minor problem.

With that fix in place, I can draw the same simple mountain shape using the "hand-drawn" lines.  Here's an example along with the original mountain for comparison:
The new mountain indeed looks more hand-drawn.  So far, so good!

Another feature of hand-drawn lines is the width of the line tends to vary.  That's a bit of a challenge in SVG because the width of a line cannot change.  So to draw a line with changing width, you have to split the line up into pieces and draw each piece a different width.  If you use a fairly small increment of change in width (around a quarter point works well for me) the line appears to be smoothly changing.  I have some experience of this because Dragons Abound can already draw rivers that smoothly grow in width as they flow toward the coast:


To start with, I'll create a line that smoothly varies between two widths.  Here's a comparison of three lines:  The first a standard SVG line, the second a "hand-drawn" line and the last a hand-drawn line that starts with a 3 point width and narrows to 1.5 points width at the end.

A narrowing line of this sort is typical in hand-drawing where the artist reduces the pressure of the pen as he makes a stroke.

Here's an example of the hand-drawn mountain with the narrowing lines, and a comparison to the previous versions:

And another example, with denser shading:
(And also an example of a line with "hook" at the end to compensate for jitter.)

Another obvious variant is to let the width of the line change semi-randomly.  In this case, I chose to let the width of the line increase or decrease by a quarter point at random intervals.  Here's a comparison of four lines:  The first a standard SVG line, the second a "hand-drawn" line, the third a hand-drawn line that starts with a 3 point width and narrows to 1.5 points width at the end, and the fourth a hand-drawn line that varies between 1.5 and 3 points in width:
And here are the random width lines used to draw mountains:
Finally, here's the end-to-end comparison:
It's striking to me how this fairly simple refinement of line-drawing can strongly invoke a hand-drawn style, even with such a simple mountain shape.

ADDENDUM

After writing this blog post, I reorganized my approach to this code.  Although the XKCD-inspired code works well for creating plots, it has a couple of issues for my use.

First, the original code assumes straight lines.  In my case, I often use D3js's capabilities to draw smoothly curved lines, and this breaks the original code in some ways that I'll describe in a future blog posting.  One of the fixes is to be able to break any line down into smaller component lines (resampling) rather than just straight lines.  Resampling a curved line is non-trivial, but one approach that works in SVG is to actually draw the curve and then use the browser's built-in capabilities to step along the curve and resample.  This is not particularly efficient, but it is very general.

Second, the original code goes to some pains to scale the jitter independent of the scale of the graph axes.  This has some problems (namely, you really want to scale the jitter by the displayed size of the lines) and in my case is at any rate irrelevant because I already know the scale of my map.  So I have modified the code to simply take a magnitude for the jitter -- it's up to the user to pick an appropriate level of jitter.

The code for resampling, jittering and creating a hand-drawn line can be found in this gist.